

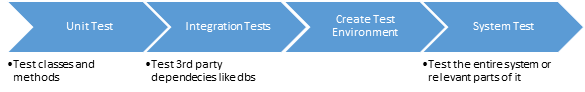
A bulwark of software engineering projects, the development pipeline is an automated process used to deliver changes from development through to production; enabling near real-time updates.
The dev pipeline is a critical time saver as it enables you to:
- Avoid mistakes (and wasted time as a result) through automation.
- Supply quick feedback for any changes in the software (good or bad).
- Operate in an isolated environment, so potential mistakes don’t affect other’s work.
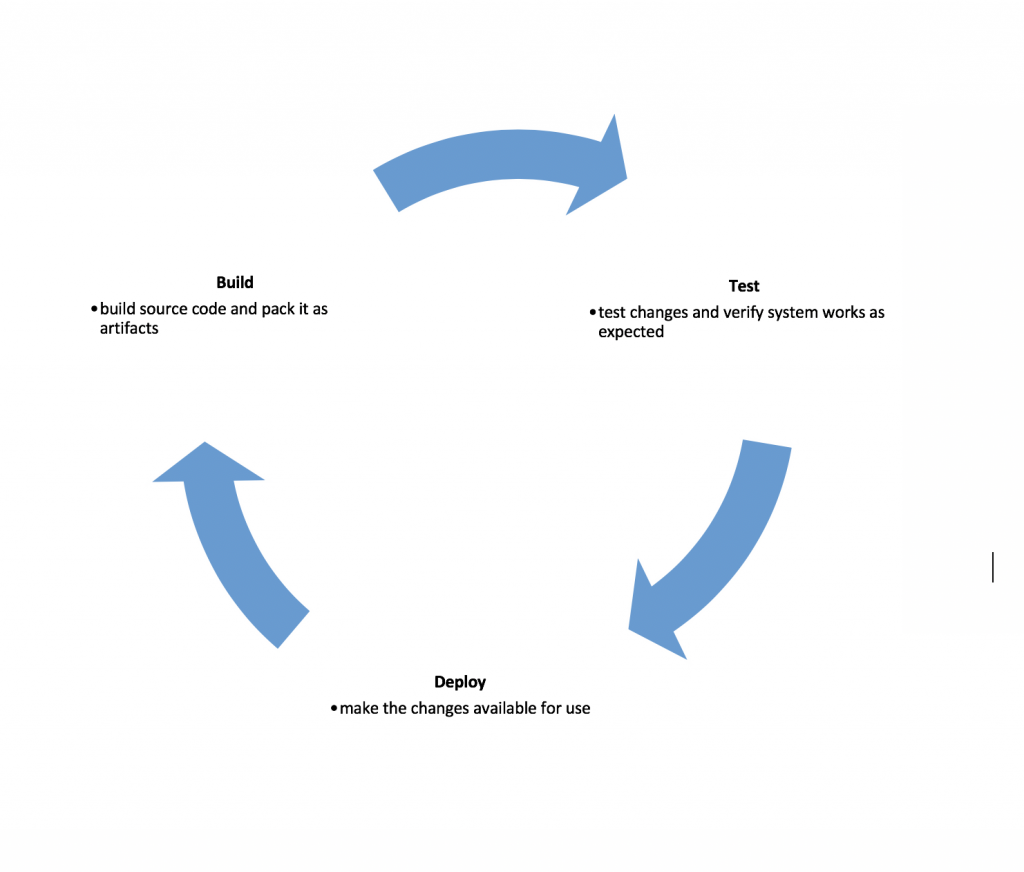
The pipeline consists of three key stages, with the constant and immediate feedback loop enabling the detection of mistakes right after they happen, minimizing production issues.
Additionally, it instills confidence in a team’s work, contributing to overall productivity and job satisfaction.
In this post, we’re going to talk about a new dev pipeline created by Maxim Kats, a DevOps engineer here at Imperva. We’ll touch on different use cases throughout the dev pipeline and, specifically, how the Docker containers platform helps us:
- Make it agnostic to the choice of development technology
- Develop robust testing practices
Let’s dig a little deeper.
Services and Flow
The base of every pipeline is the services it uses – from the software used on a local development environment to the build servers and managed services. Here are some details of the services and flow we use in our pipeline:
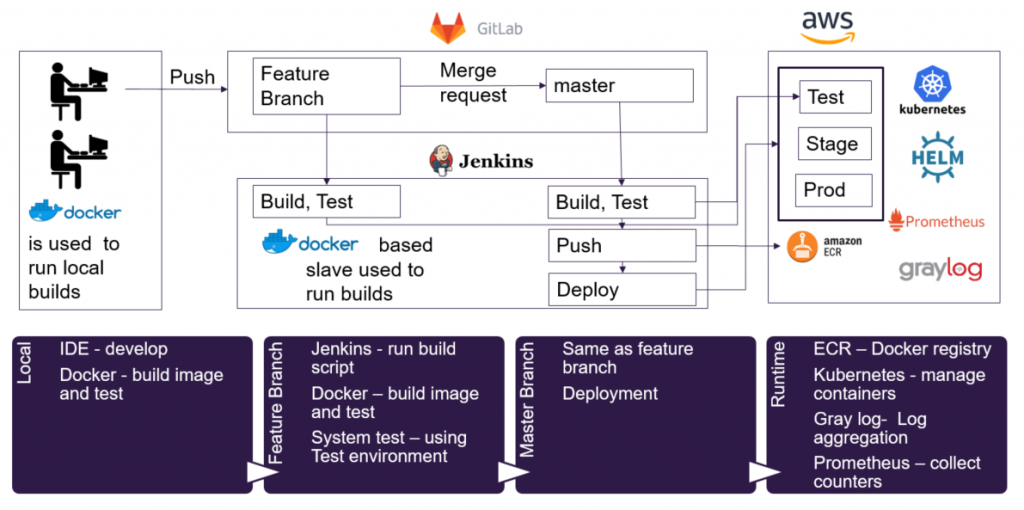 Figure 1: Development pipeline flow
A change is pushed from the local development environment to a feature branch and later to a master branch. After a successful test run, changes are deployed. Next up we’ll explain our choices regarding the different steps of the pipeline flow, including requirements and implementation notes. We’ll also explain the benefits and docker use cases.
Pipeline Requirements and Benefits
Coding language/technology agnostic
Docker works well with Java/Python/Go and other coding languages, without changing the pipeline services. In our local dev environment, we use an Integrated Development Environment (IDE), which can change from one team or developer to another.
The rest of the pipeline is agnostic to the technology; it uses Docker to build images and run tests. A Jenkins slave, which is a dedicated machine for running builds, is installed with Docker and both builds and tests are done inside containers.
Jenkins has an “agent” directive, which lets it use docker with pipeline. It allows running a script inside a Docker container, based on image name or a Dockerfile.
Here’s an example of how tests can run inside a container using Jenkins “dockerfile” agent:
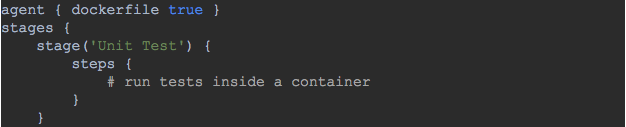
Figure 2: Jenkinsfile example – how to run tests inside a container
Running tests inside a container based on your dockerfile keeps the Jenkins slave clean. You don’t need to install Python, Java or any other runtime to run your tests, and you keep your pipeline agnostic to the technologies used.
Same operating system and dependencies all the way
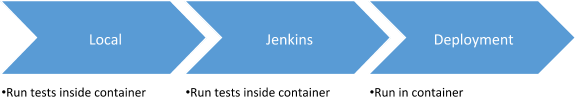
We use Docker to make sure the same OS and dependencies are used along the pipeline by running tests inside containers:
Ever heard developers say: “Why doesn’t it doesn’t work during the build? It works perfectly locally. Build passed, but it doesn’t work on a production system because of the OS.”
Running tests inside containers will dramatically cut down on these issues – code will not be pushed without testing it on the right OS first, and with the right dependencies.
As mentioned in the previous section – you can use the “dockerfile” option to run tests inside a container in Jenkins. In a local environment, an efficient way to do it is by using IDE with Docker integration. Such IDEs allow running “Docker build” and controlling containers. Here are some options from Intellij Docker integration:
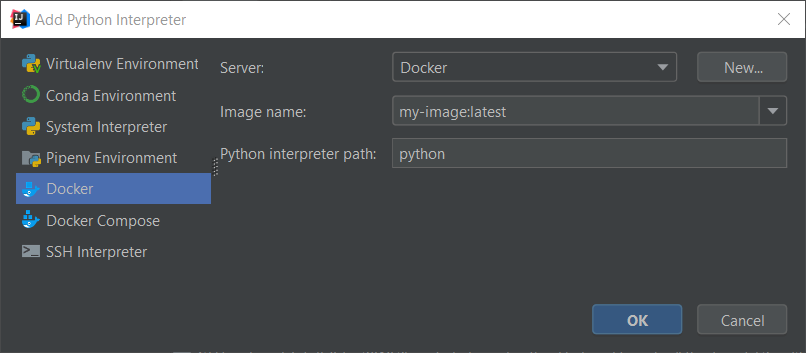
Figure 3: Add an interpreter based on Docker (local or remote) and your image. After defining the interpreter we run tests inside a container and used IDE capabilities to watch failures, return failed tests and more
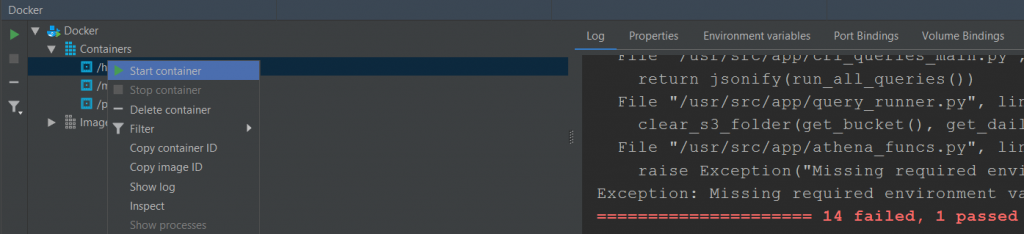
Figure 4: Docker panel – control containers, see options like test logs and more
Integration tests using Docker
To strengthen our testing and make it modular, we bring up containers as part of our tests. We use it to test dependencies like databases, cache services, automate web browsers etc.
Below you can find examples using the Python test containers library, designed for using containers to integrate with databases and browsers.
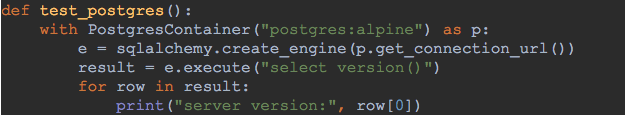
Figure 5: Bring up Postgres database as part of Python integration test. Can be used to test the application data layer or any other database use
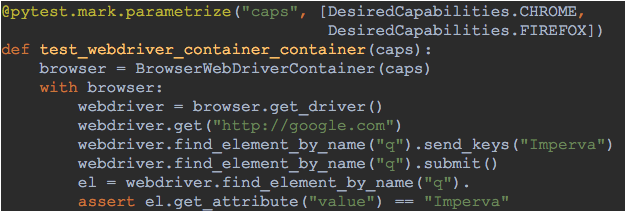
Figure 6: Test your website using multiple browsers, to verify your web application works as expected with multiple browsers
The build test results
System tests
System tests are used to test the entire system, or the relevant parts of it, in an environment similar to production. An example would be to test an updated microservice using its updated code, in an environment with its depended microservices.
In our pipeline, system tests can run in two ways:
- Bring up all dependencies as a pre-step to the system tests.
- Use the test environment by deploying a temporary container with a new change. We also use different cloud accounts (test, stage, production) to allow testing managed services like Amazon S3.
This is the full test flow:
Here’s an example in which a test runs with one depended service. The system test dependency is defined in the Jenkins file as follows:


Figure 7: Run system test – inject dependency URL to a deployed service in the test environment
A new container is deployed with the updated code and uses the latest dependencies deployed on the test environment.
Kubernetes health check and resources limitation
Kubernetes is a docker cluster manager that allows us to control and monitor our containers. We added deployment configuration to let the developer choose the deployment configuration and thresholds.
Here are some examples of resources and health configurations:
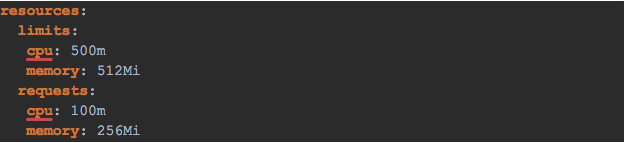
Figure 8: Kubernetes CPU and memory thresholds configuration
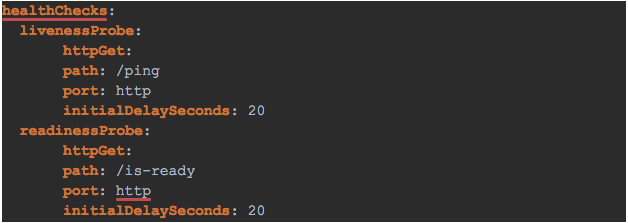
Figure 9: Kubernetes Liveness and readiness configuration
The configuration files are saved inside each microservice and simply used during deployment to Kubernetes. Resource limitation health-checks and more are all features of Kubernetes.
Multi-region deployment
GDPR and other regional privacy regulations have shoved compliance into the forefront of cybersecurity. And whether we like it or not, for many of us, data and servers now reside in multiple cloud regions. As such, we have to store our customers’ data and process it using microservices in multiple regions. We deployed Kubernetes clusters in all of the regions we support, and added deployment capabilities for multi-region deployment:

Figure 10: Configuration file for deployment on 4 different Kubernetes clusters, in 2 regions
Configuration options vary from one region to another, so we hold a base configuration file, and one per region. The regional configuration can add new parameters, or override the base ones:
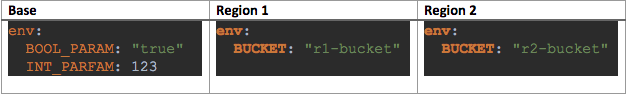
Figure 11: Multi-region deployment configuration
Helm is a Kubernetes package manager that helps us deploy the same microservice in different regions. Helm has a “-f” option which allows using multiple deployment setting files with values to override defaults.
Monitoring logs
We are using graylog to aggregate all of our logs data. Data is sent from the containers to graylog in seconds, and it’s possible to monitor multiple containers from multiple regions in one system.
Here are some search examples we use:
- Use container-name field to find microservice issues in all regions.
- After detecting an issue with a service, add a time slot – for example, 5 minutes before and after, and then add more services to search for a multi-container flow
- Bug hunting – by searching for errors in the logs all over the system.
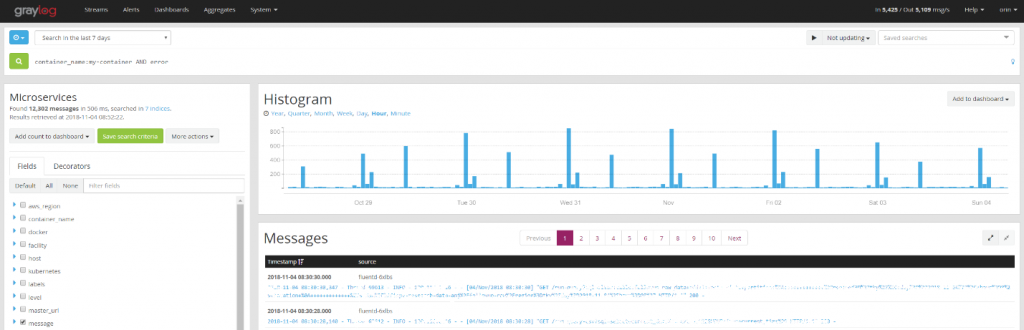
Figure 12: Screenshot of graylog, including our fields like container name and region
Monitoring counters
Another important part of our environment is the monitoring of counters, done by Prometheus time series DB and grafana analytics and monitoring; both are open source projects.
When you add monitoring counters to your service you have to update your kubernetes deployment manifest file in the following way:

Figure 13: Deployment configuration for monitoring counters, utilizing “Prometheus kubernetes service discovery” feature
After that, you have to implement the counters. Here’s a Python example based on Flask web framework and Prometheus client library:
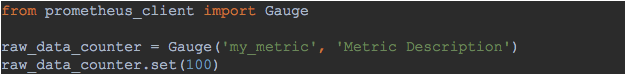
Figure 14: create a counter and report one value using Python Prometheus client
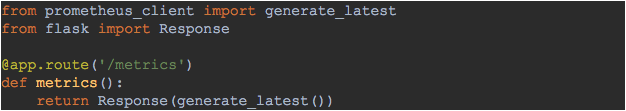
Figure 15: Add a route to allow counters collection by Prometheus
In this example, you can see how a counter is reported and later sent to Prometheus. The generate_latest function is implemented in the Prometheus_client library. This function collects all the reported counters.
Here’s what a dashboard looks in Grafana:
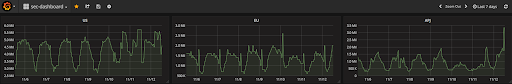
Figure 16: Grafana dashboard example
Prometheus also allows you adding monitoring alert rules. For example, if a counter is supposed to be between 2M and 6M and it is out of normal range you can get an email or a Slack report about it.
A good development pipeline saves time and in this post, we’ve demonstrated how Docker helped us improve our pipeline; and highlighted some of our testing capabilities. We also showed some of our monitoring capabilities like log aggregation and counters.
Automation, strong testing capabilities and monitoring prevent mistakes and allow your team members to fall fast without affecting others, which makes for a happier team with better results at the end of the day.
Investing in your pipeline will save you time, and presents a great opportunity to review your current processes and improve them.
Try Imperva for Free
Protect your business for 30 days on Imperva.