

Our dev team has been busy making some changes to the management console we think you’ll appreciate. The updated console allows you to access the full functionality of your Incapsula service from any device, is a lot easier to navigate, and provides greater degree of relevant information at a glance.
We’ve been beta testing the new account interface for several months with many of our Business and Pro clients. This week, we rolled out the new interface to all Incapsula users. Since a picture is worth a thousand words, I’m going to cover these changes in a visual walkthrough.
Streamlined User Experience
In the previous interface, you needed to open a separate tab to access information about your network traffic. This caused problems when trying to load the real-time traffic section, which would have to repopulate with each refresh. The new interface uses a menu on the left side that, in addition to being more intuitive, also doesn’t have to reload with each sub-section load or refresh.
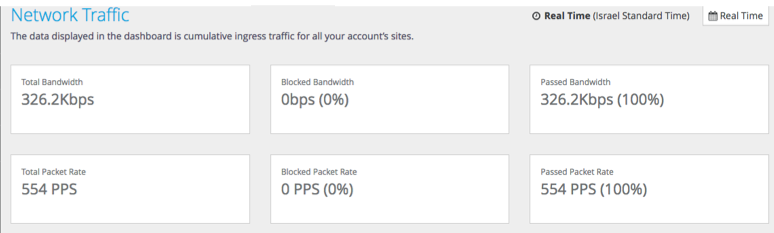
Now, you can access detailed information about your infrastructure traffic from the same page as all your other subaccounts and sites – no need to open another tab or browser window – for a more unified and streamlined experience.
Detailed Site Stats At-a-Glance
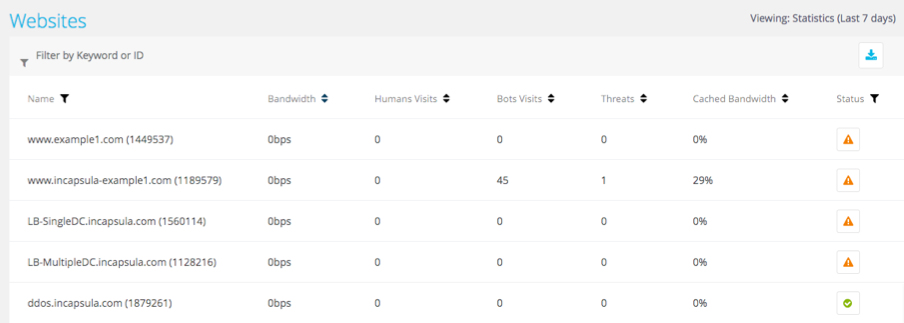
Another neat feature is the ability to see the breakdown of relevant stats about your websites, including:
- Bandwidth – the overall throughput to your site
- Human Visits – the number of visits made by real people
- Bot Visits – the number of visits made by automated agents
- Threats – indicates the number of detected threats
- Cached Bandwidth – percentage of total requests that are being served from cache
- Status – icons show whether everything is okay, or if something needs your attention
This lets you quickly glance at the health and status of your websites and check for any anomalies without having to drill down into each site.

Responsive Design
Finally, to accommodate many of you who have to log in to your dashboard outside regular office hours when you don’t have access to your laptops, we’ve made the dashboard fully responsive for mobile devices.

Previously, you could only view alerts, certain stats, and a reduced dashboard on your mobile devices. Now, you have full access to the entire range of functionality that you have on your laptops, including making system and config changes, and writing and deploying custom rules.
With the updated Incapsula management console you can now configure many aspects of your subscription. We encourage you to familiarize yourselves with the new dashboard and let us know what feature you like most!
Try Imperva for Free
Protect your business for 30 days on Imperva.